At least once a week I get paged at work for a database log file growing and filling the drive. So one of the tricks I use for narrowing down the scope of these scenarios is to find the login associated with most of the log growth events. This process works for both log and data files.
The query I usually start with is the following:
DECLARE @p nvarchar(260) = (SELECT path FROM sys.traces WHERE is_default = 1);

SELECT
      t.StartTime
    , t.DatabaseName
    , t.FileName
    , t.EventClass
    , growth_mb = t.IntegerData * 8 / 1024
    , ms        = t.Duration / 1000
    , t.ApplicationName
    , t.LoginName
FROM sys.fn_trace_gettable(@p, DEFAULT) AS t
WHERE 1=1
    AND t.EventClass IN (92, 93) -- 92 = data file, 93 = log file
    AND t.StartTime > GETDATE()-1
ORDER BY t.StartTime;
This query shows me the log and data file growth events from the last day in the current trace file. sys.traces gives me the path to the default trace, and sys.fn_trace_gettable reads that file as a table. I filter the Event Class by events 92 and 93 to only show the data and log file growth, respectively.
I’ve generated some artificial log and data growth in an example database I created to demonstrate what the output typically looks like:
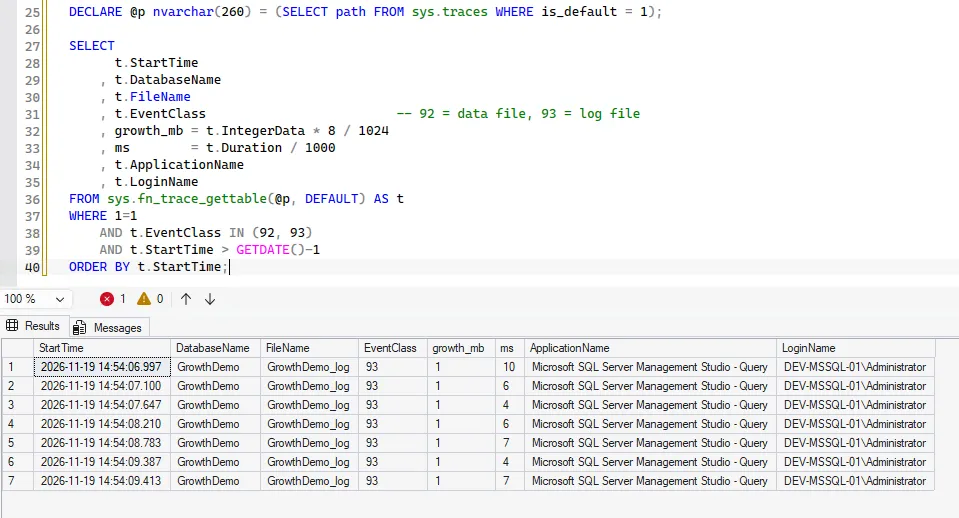
The output is pretty simple. The 93 in EventClass means it was the log file that grew, and LoginName is the login the trace recorded with that growth. I use this all the time for postmortems, but it isn’t a silver bullet, for two reasons.
The first is that it only goes back as far as the default trace does. The default trace writes to a set number of files with a maximum size each, and it rolls over to a new file when the current one fills up. So how far back it reaches depends on how busy the server is. You can see the limits for your instance in sys.traces:
SELECT path, max_size, max_files, start_time, last_event_time
FROM sys.traces
WHERE is_default = 1;
The path in that view is the current trace file, something like log_412.trc, and not the oldest one. sys.fn_trace_gettable starts at the file you give it and reads forward through the rollover files after it, so my original query only ever reads the current file. The GETDATE()-1 filter also drops anything older than a day. If you need to go back further, point the function at log.trc in the same folder so it starts from the beginning, and take the date filter out:
DECLARE @p nvarchar(260) = (
    SELECT REVERSE(SUBSTRING(REVERSE(path), CHARINDEX(N'\', REVERSE(path)), 260)) + N'log.trc'
    FROM sys.traces
    WHERE is_default = 1
);

SELECT
      t.StartTime
    , t.DatabaseName
    , t.FileName
    , t.EventClass
    , growth_mb = t.IntegerData * 8 / 1024
    , ms        = t.Duration / 1000
    , t.ApplicationName
    , t.LoginName
FROM sys.fn_trace_gettable(@p, DEFAULT) AS t
WHERE 1=1
    AND t.EventClass IN (92, 93) -- 92 = data file, 93 = log file
ORDER BY t.StartTime;
I hardly need to use this one since I’m usually getting pulled into the incident as it’s happening, but I figured I would share this nonetheless.
The other gotcha with this is that while it tells you which login was running when the file grew, it doesn’t mean that login was the problem. For example, you could have a process that runs every few seconds and fills most of the log. Then the very next write to the file from some normal activity could be the one that triggers the growth and shows up in the trace, which means we would never see our true problem. So my general rule of thumb when using this query as a tool is to look for consecutive offenders during the exact period of growth, and compare that to times outside of the problem window. This helps give me confidence to look at a login and reach out to that person or the SME on that application to figure out next steps.
To compare logins across the whole trace, I group the same rows by login and file. This gives a summary of who is growing what:
DECLARE @p nvarchar(260) = (
    SELECT REVERSE(SUBSTRING(REVERSE(path), CHARINDEX(N'\', REVERSE(path)), 260)) + N'log.trc'
    FROM sys.traces
    WHERE is_default = 1
);

SELECT
      t.LoginName
    , t.DatabaseName
    , t.FileName
    , file_type       = CASE t.EventClass WHEN 92 THEN 'Data' WHEN 93 THEN 'Log' END
    , growth_events   = COUNT(*)
    , total_growth_mb = SUM(CAST(t.IntegerData AS bigint)) * 8 / 1024
    , total_ms        = SUM(t.Duration) / 1000
    , first_growth    = MIN(t.StartTime)
    , last_growth     = MAX(t.StartTime)
FROM sys.fn_trace_gettable(@p, DEFAULT) AS t
WHERE 1=1
    AND t.EventClass IN (92, 93) -- 92 = data file, 93 = log file
GROUP BY
      t.LoginName
    , t.DatabaseName
    , t.FileName
    , t.EventClass
ORDER BY total_growth_mb DESC;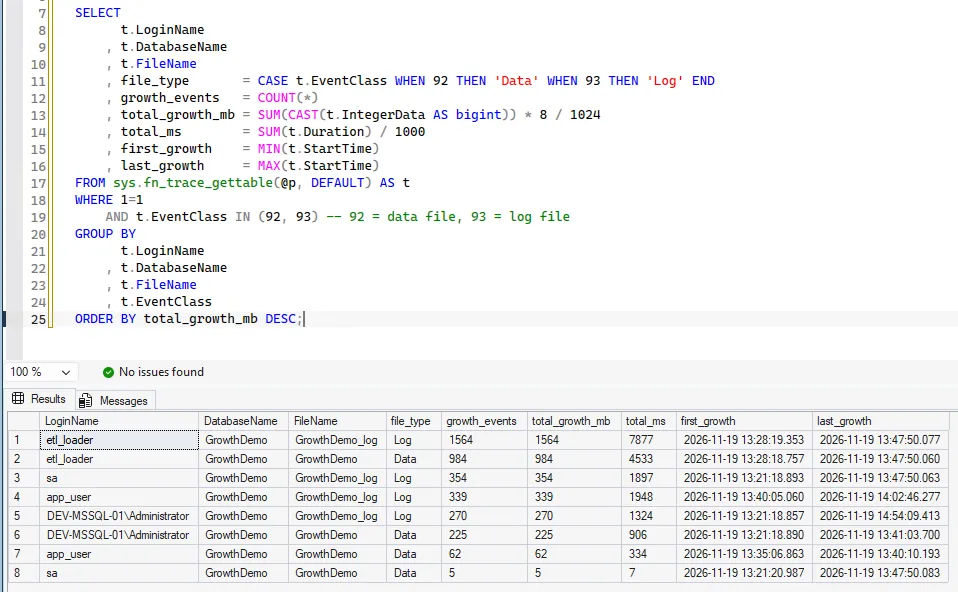
The growth_events and total_growth_mb columns match in every row here because my demo database grows 1MB at a time. On a real database with a larger growth setting they won’t.
The first_growth and last_growth columns show whether a login’s growths all happened in one window or are spread out over the whole trace. A login with a lot of growths in one short window is a different conversation than one that grows the file a little every day.
I’ve found use out of all of these queries at some point, and a lot recently, so I wanted to share this with anyone else who might be facing the same problem.